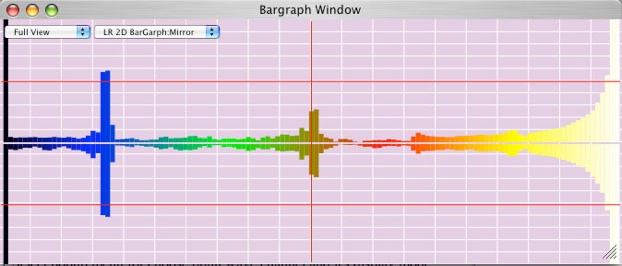
7: Bar Graph

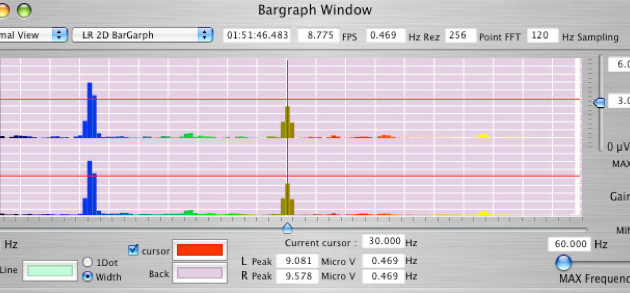
Shows 2D Bar graph window.
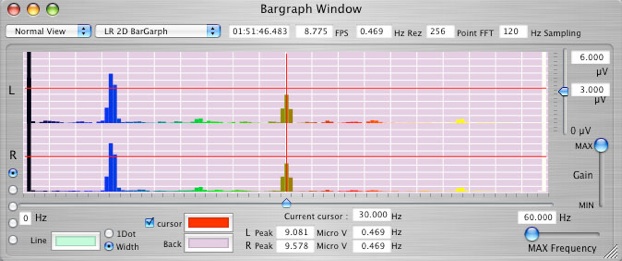
Select popup menu for choose brain wave channel and it's display mode.
Top of window shows current time point, display FPS, FFT point number and sampling Hz.
Select left down corner change color map use for draw 2 D graph.
Select "1 Dot", "Width" select Line width to draw 2 D graph.
Select "cursor" shows cursor.
Move bottom slider move cursor position and frequency field shows it's frequency.
Move right slider move cursor position and power field shows it's power.
Shows CH 1 and CH 2 peak power and frequency.
Max frequency slider change to show Max frequency.
Max gain slider change to show Max power.
View popup menu for select view mode.
Normal View
Full View
Alpha 1.0, 0.8, 0.6, 0.4, 0.2
Alpha Animation 1.0 .. 0.0
Alpha Animation 1.0 .. 0.2
Alpha Animation 0.8 .. 0.4
To print image :
select
Graph / Grab & Save -> select grab image
then
Graph / Print Grab Image...
7.1: Select "Graph/Bargraph Window"